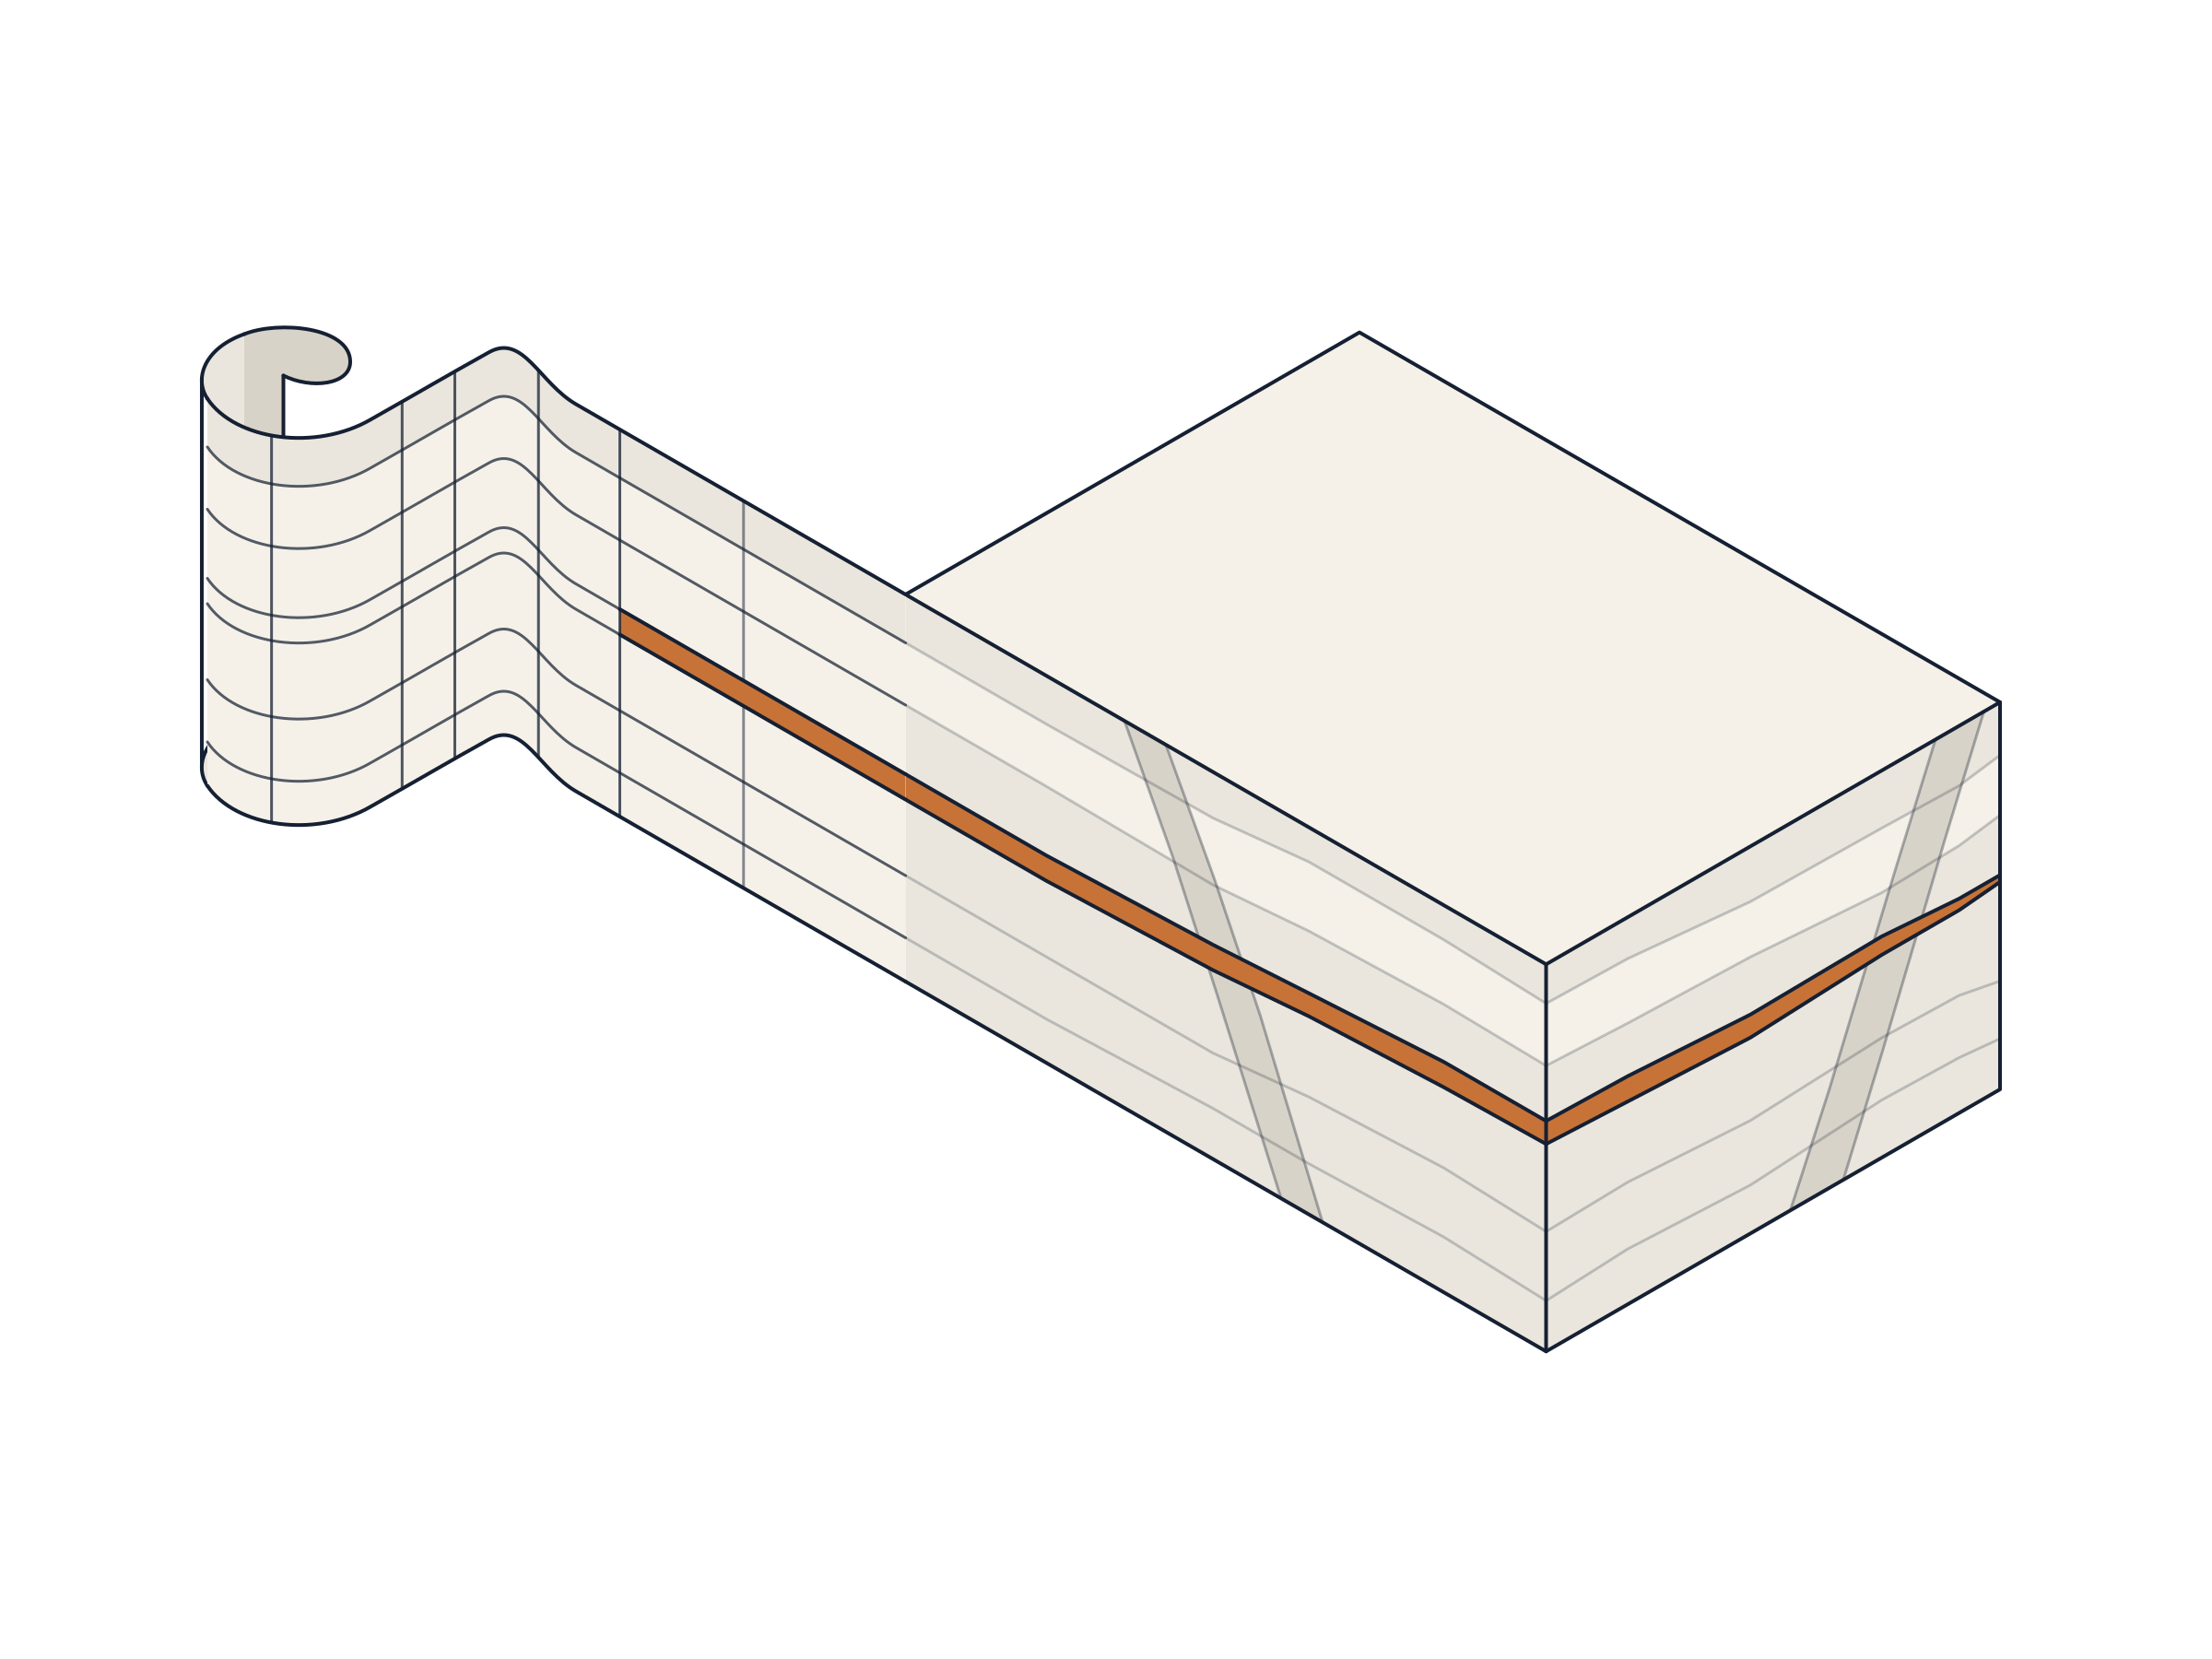
Load the mine plan
Use the Excel export from your planning software or the workbook your team prepared. Review the columns and units before confirming the import.
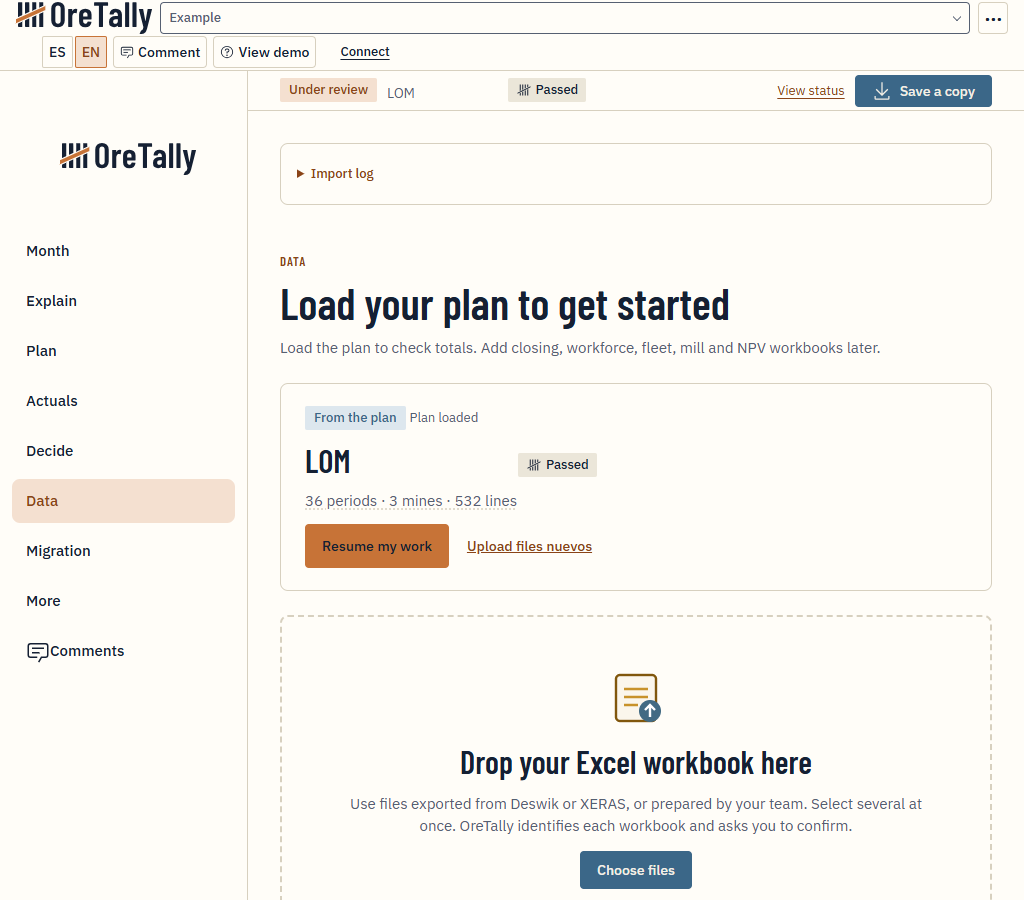 View the Excel import

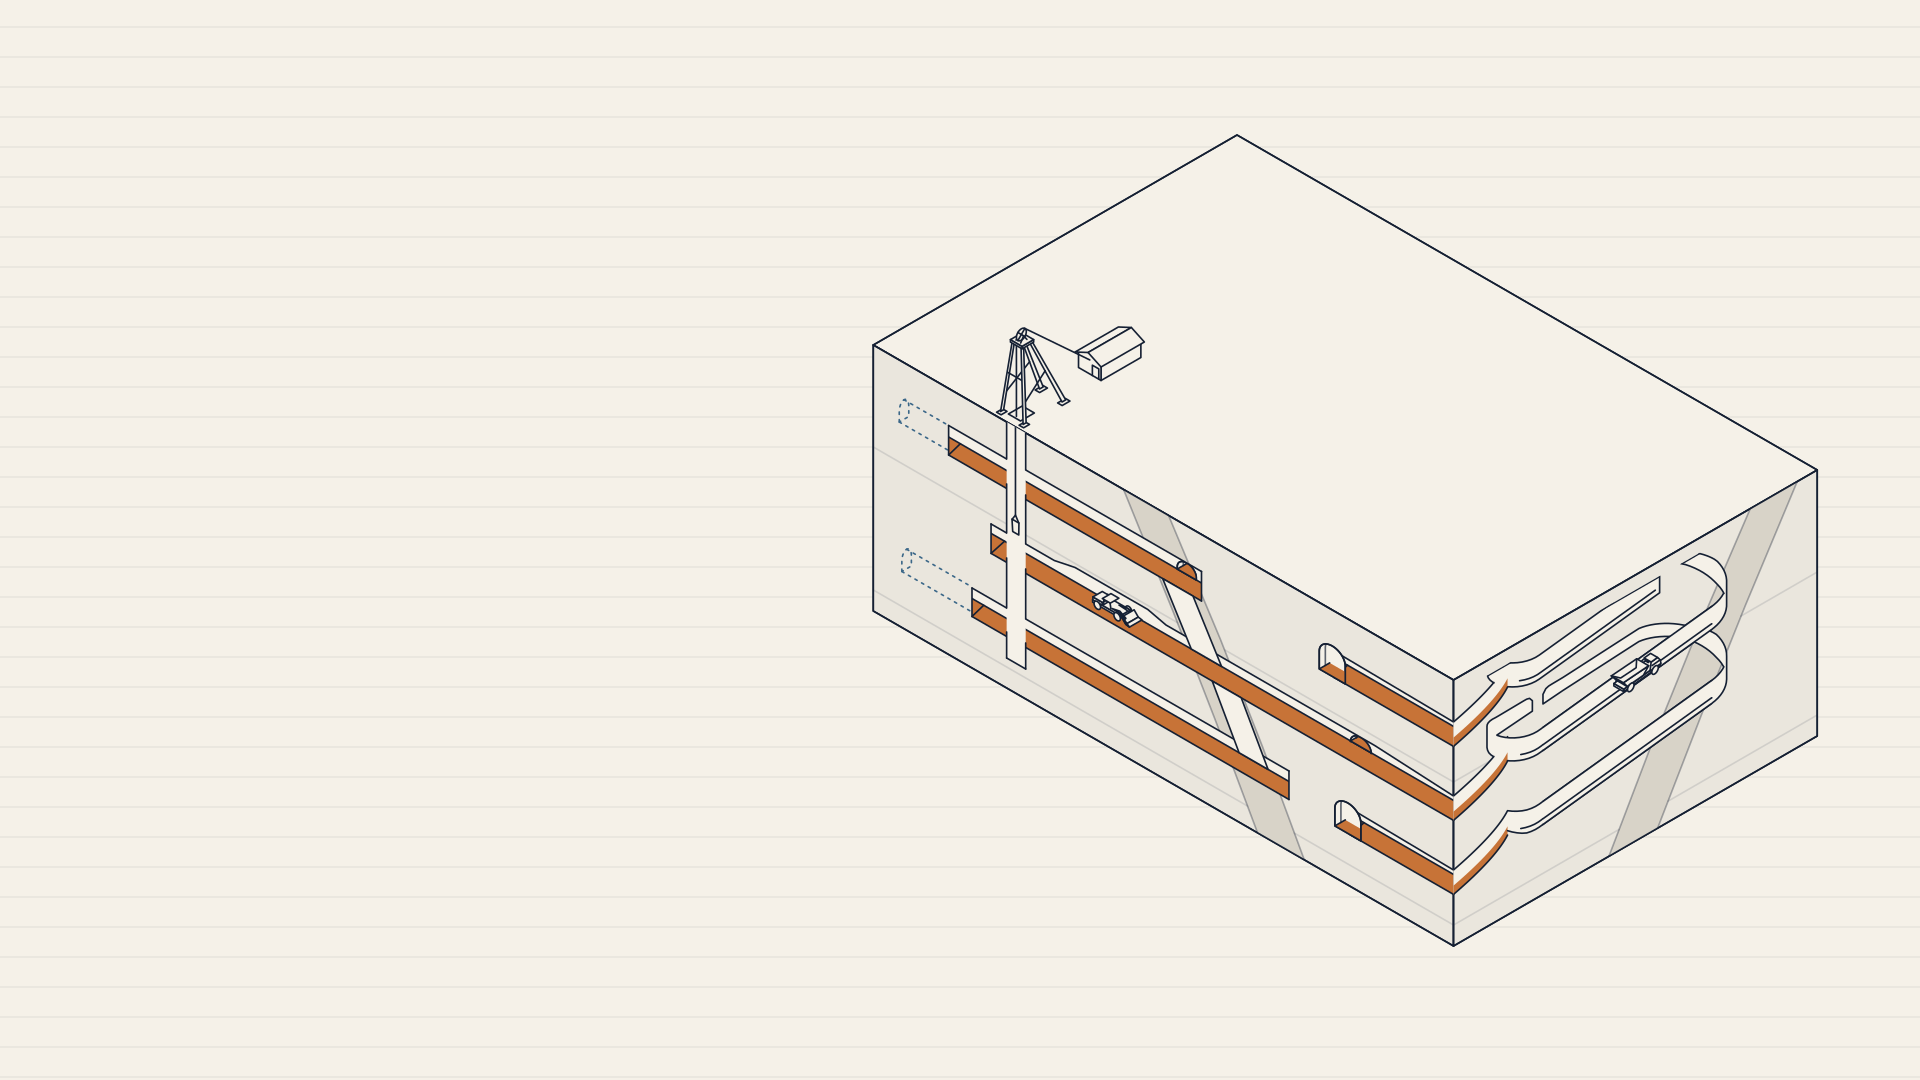
OreTally takes the metres, tonnes and equipment hours in your mine plan and calculates the cost of each line item. When a cost changes, you can see what drove it.
Use the Excel export from your planning software or the workbook your team prepared. Review the columns and units before confirming the import.
View the Excel import
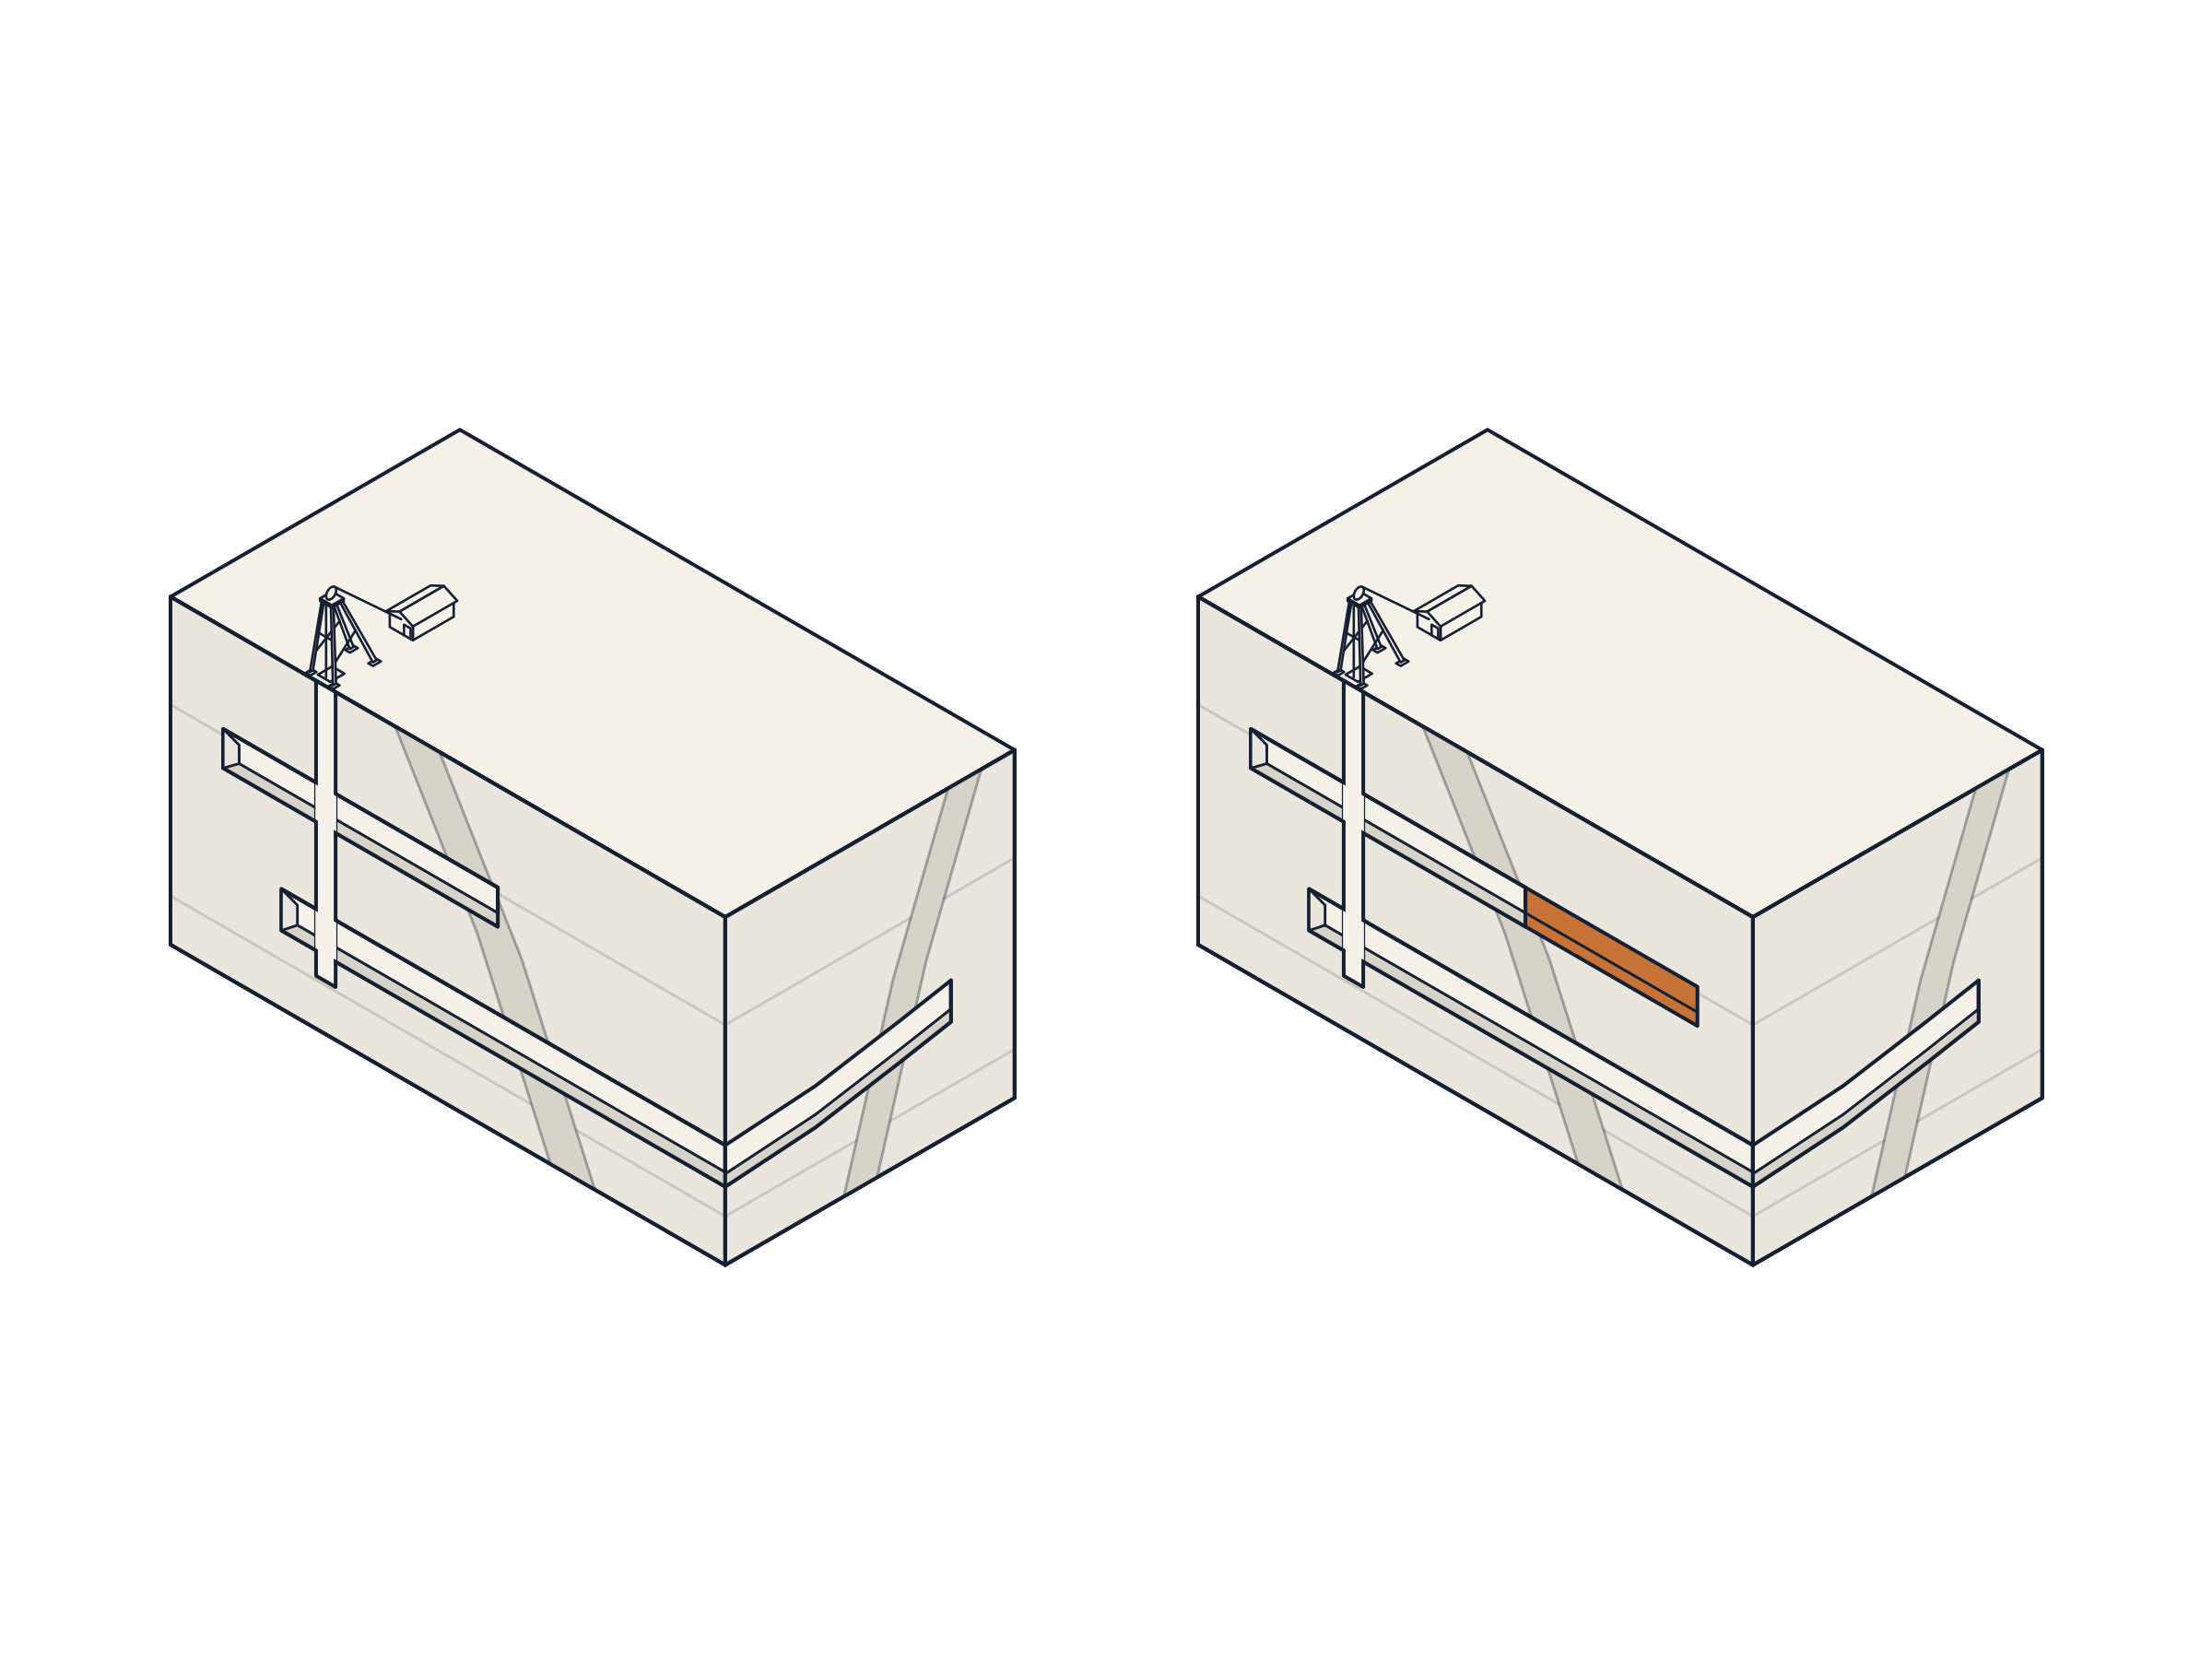
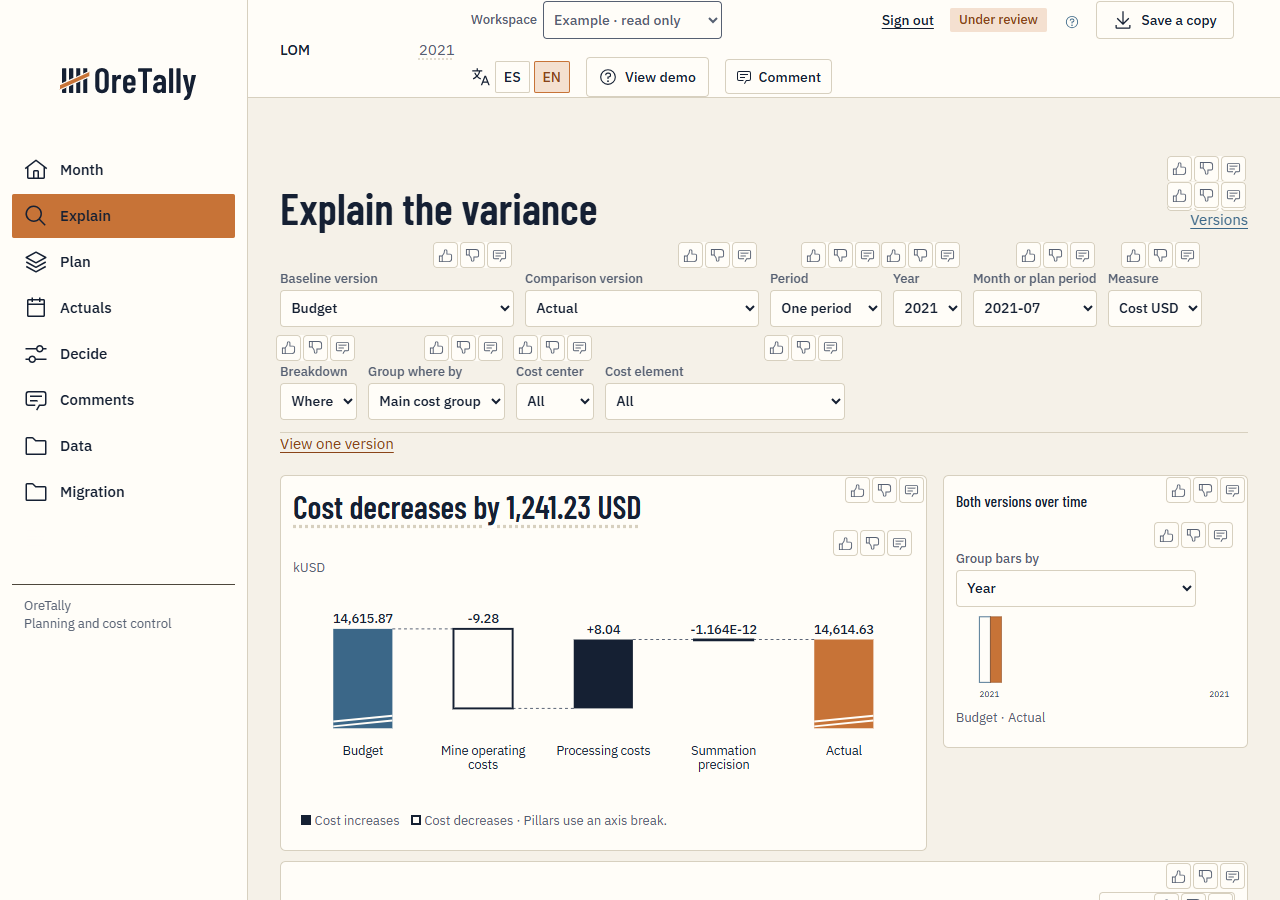
Compare two versions. OreTally breaks down the difference in a fixed order so you can see the effect of quantity first, then consumption, then price.
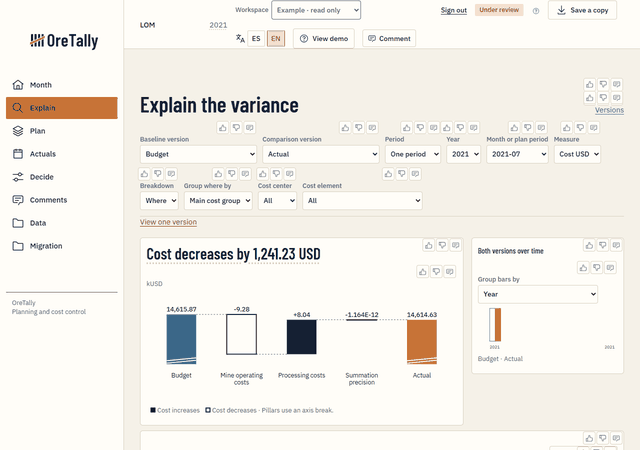 View the comparison
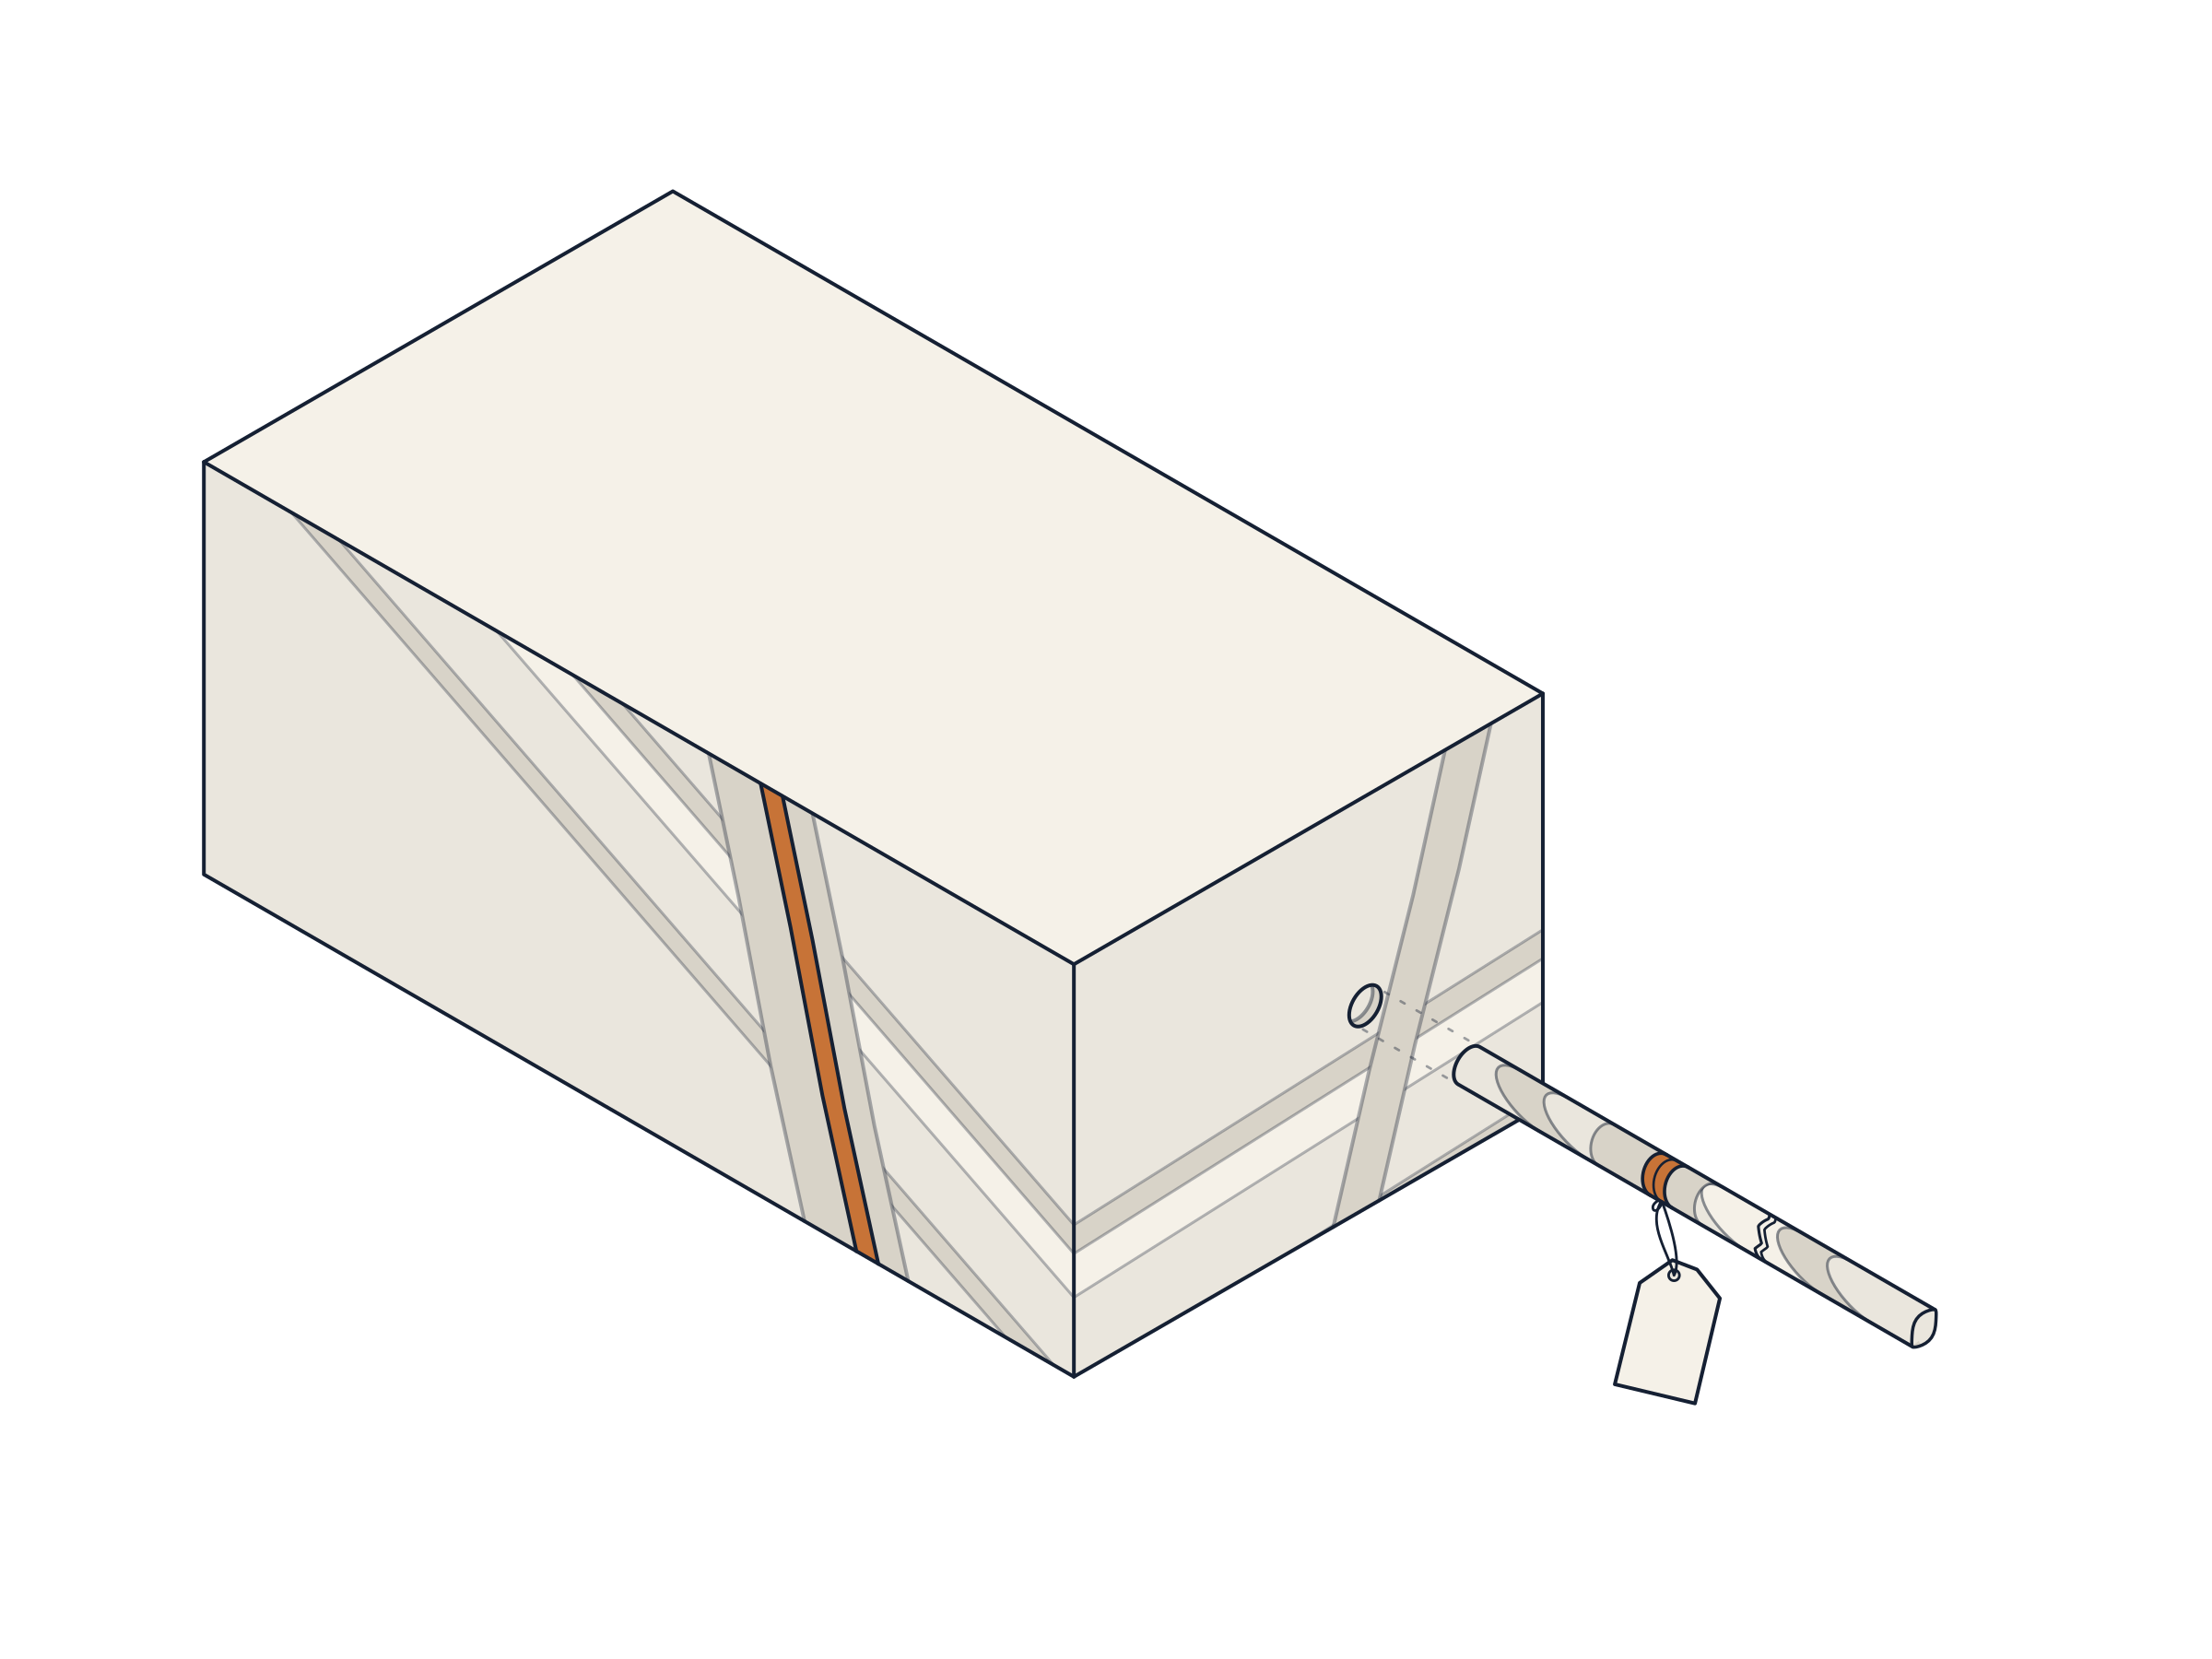
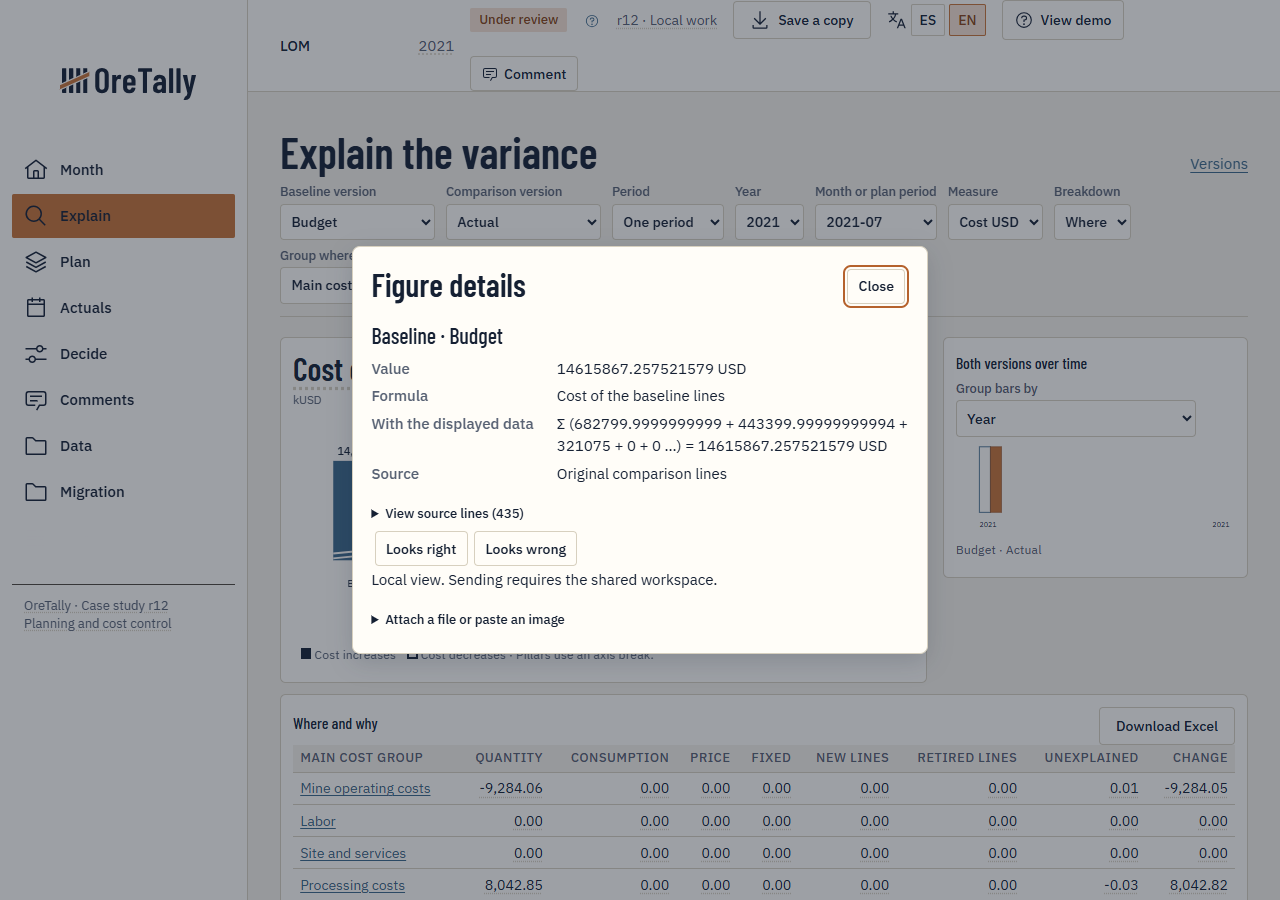
Open a figure to see the formula and the data behind it. If you have a question, leave a comment on the number you are reviewing.
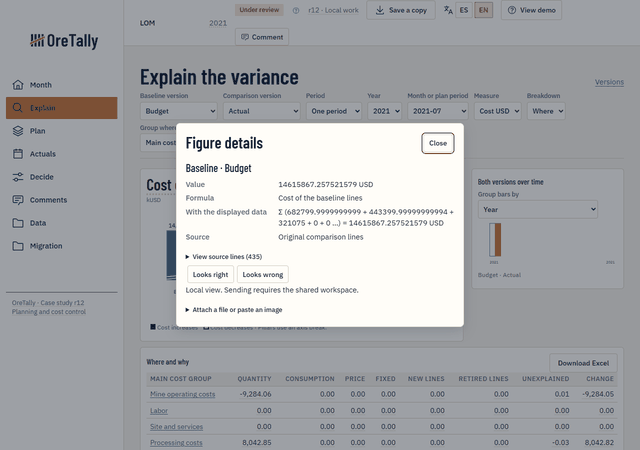 View the figure details
Four views from the example workspace. Open any screenshot to read it at full size.
Read the plan, actual cost and variance together for the selected month.
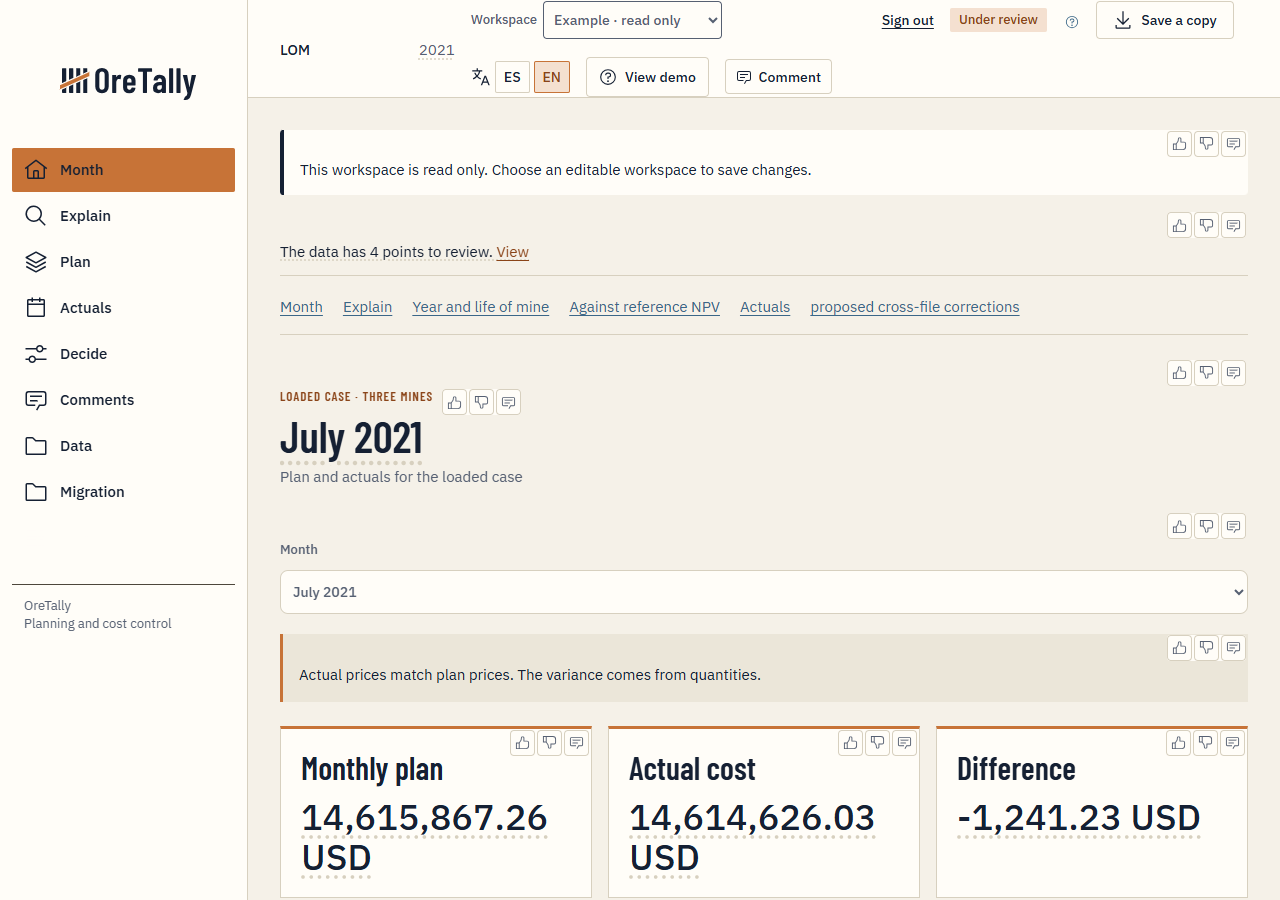
The chart shows which cost items account for the difference between two versions.
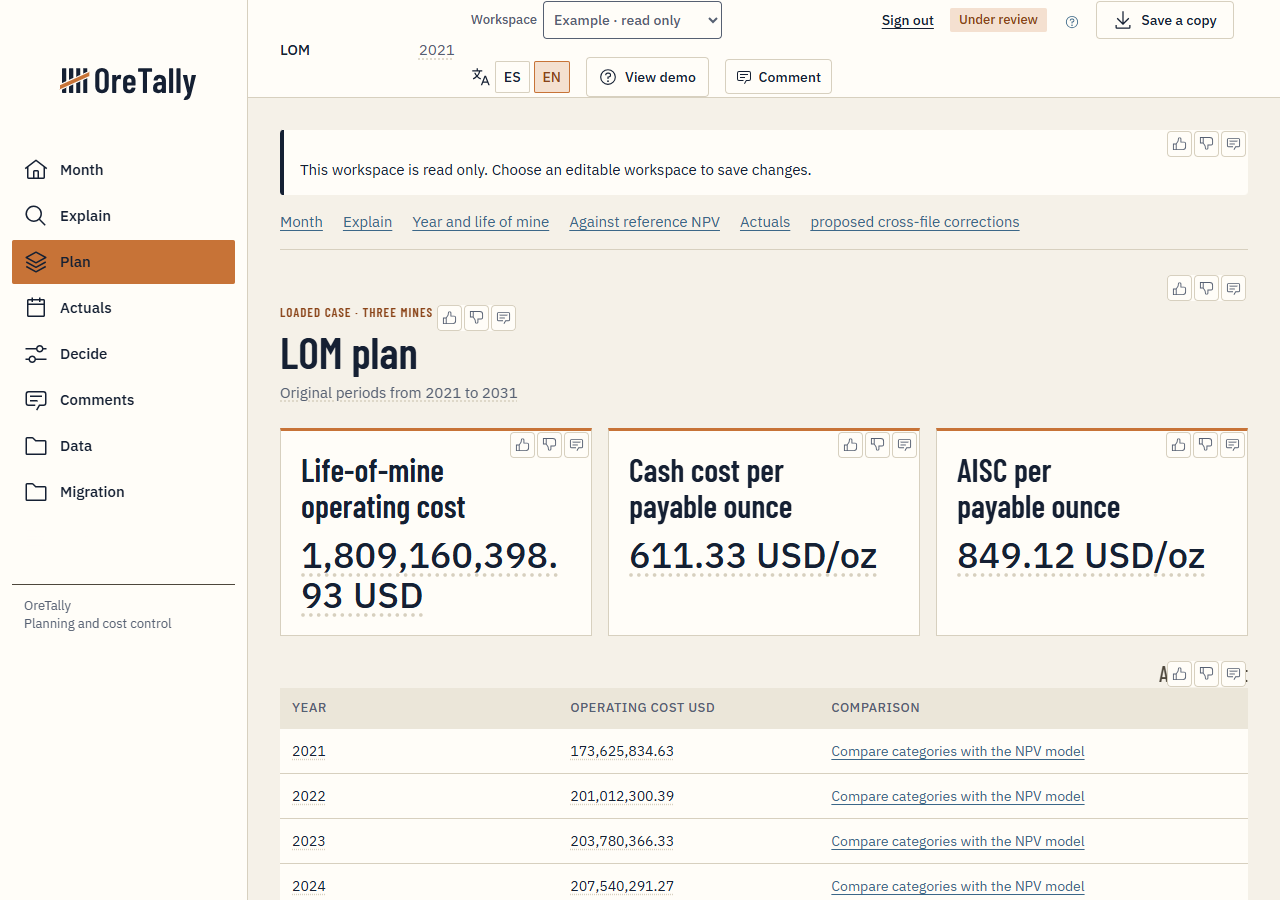
The table lists annual operating costs across the life-of-mine plan.
Open a value to see the detail behind its calculation.
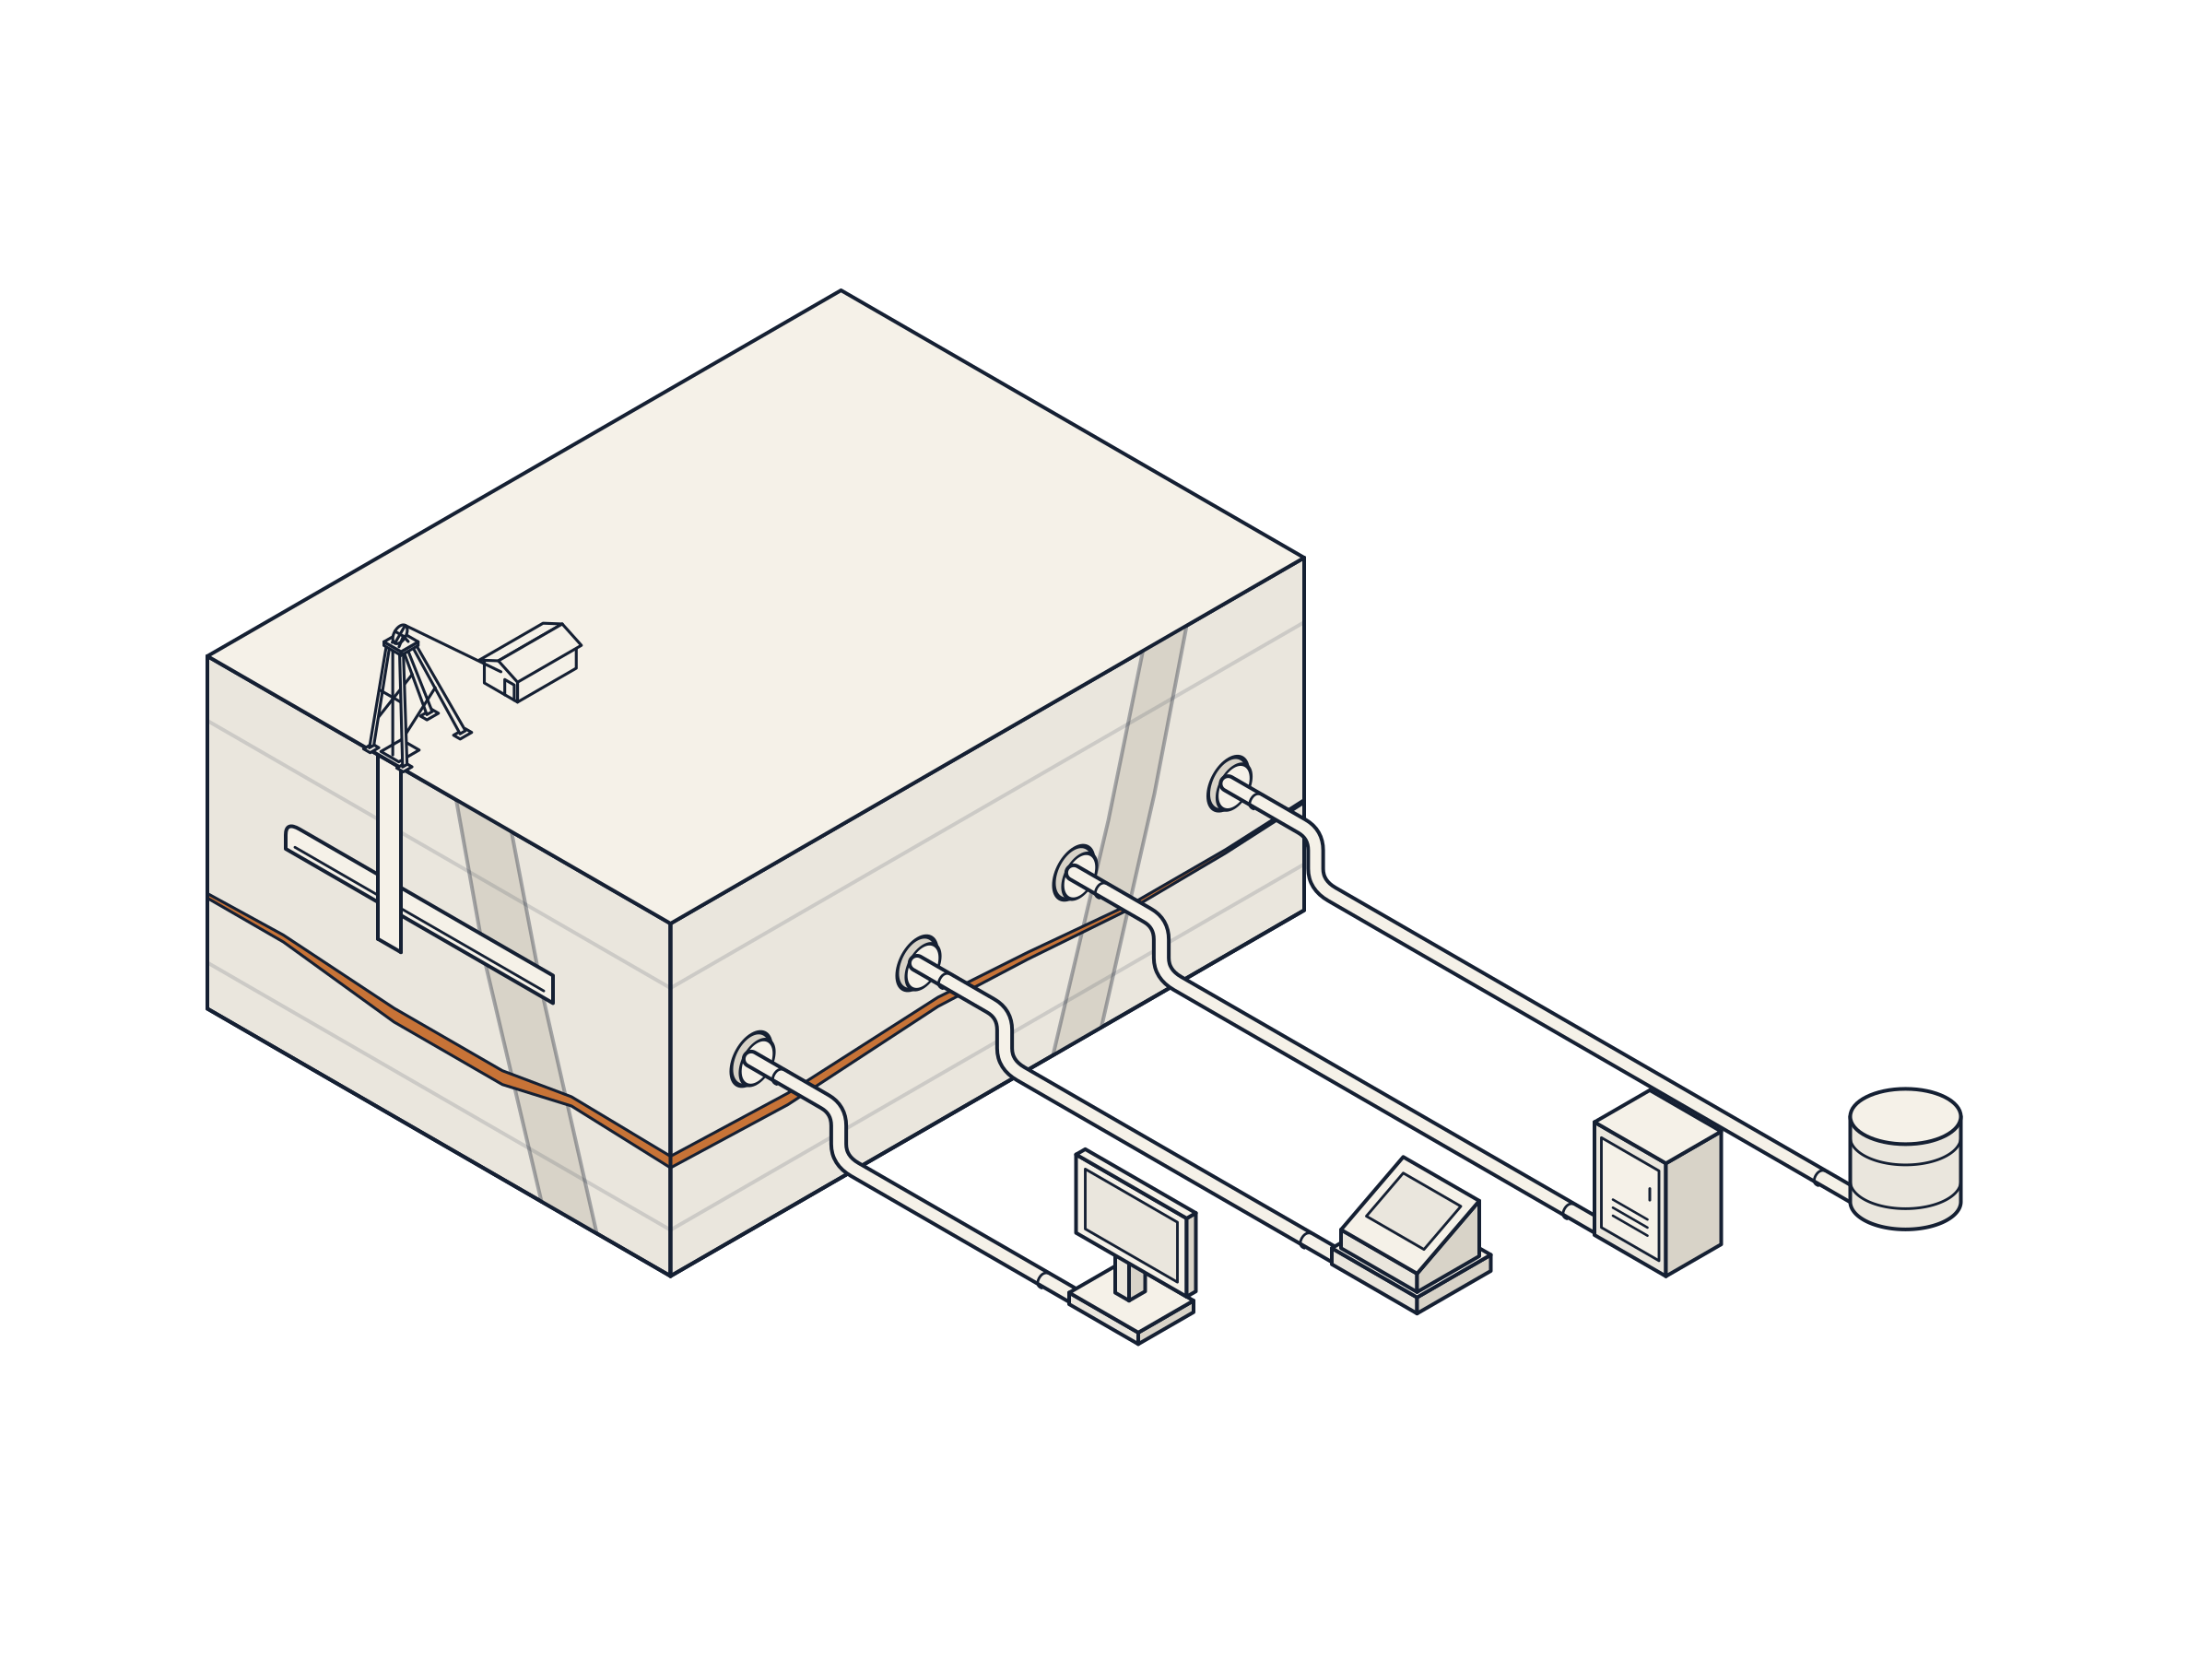
Read published results in Excel or Power BI. Use SQL queries or Python to work with the same figures in your own analyses.
Sign in with your Microsoft or Google account.
Each team has its own isolated workspace.
Workspace data is stored in Azure.
If your account needs access, you can request it from the application.
